I need lightning strike data, and I need it lightning fast
Natural resource safety teams need reliable, near-live feeds they can plug into ArcGIS. Lightning is a top request in forestry - strikes can start fires and injure crews. There are expensive commercially available data feeds. However, the World Wide Lightning Location Network (WWLLN) publishes a global Keyhole Markup Language file (KML) with a 1-hour window that updates every 10 minutes. I built an ArcGIS Notebook that converts this KML into a time-enabled feature layer, which applies better styling and refreshes hourly. No vendor contract needed.
As a Customer Success Manager working with natural resource sector customers, I often hear about challenges finding authoritative and consistently available feeds that can be integrated into safety operation centers. These are live or near-live feeds providing geo-located intelligence about what’s happening on the ground within the areas of operation, affecting safety and security for staff and assets. In the past, I’ve covered feeds that integrate into ArcGIS Dashboards, such as live flood extents, smoke forecasts and power outages.
For companies in forestry, weather events like lightning strikes can cause significant damage and destruction, with a high potential to spark wildfires. Data on lightning strikes is a frequent request from my customers, so I went searching. There are commercially available repositories of archived and live lightning data. However, I found a source for global lightning strikes that we can use right now in safety and emergency management operations.
The World Wide Lightning Location Network (WWLLN) is a global network of very low frequency (VLF) sensors monitoring lightning activity across the planet. It’s a collaboration between the universities of Washington, Otago and the Earth Networks. Archival data can be purchased, while semi-live WWLLN data is available in 10-minute intervals for research purposes. They also publish a rolling 6-hour time-delay layer with a 1-hour window as KML. This is the layer we’ll use.
We can find the layer here.
This layer can be added directly to ArcGIS Online Webmap Viewer using the Add Layer URL in the graphic below:
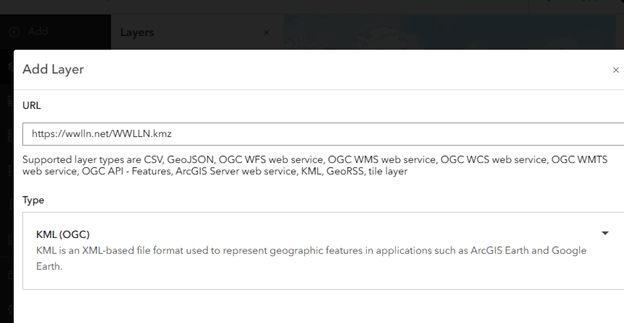
Image showing Add KML Layer
The result looks like this:
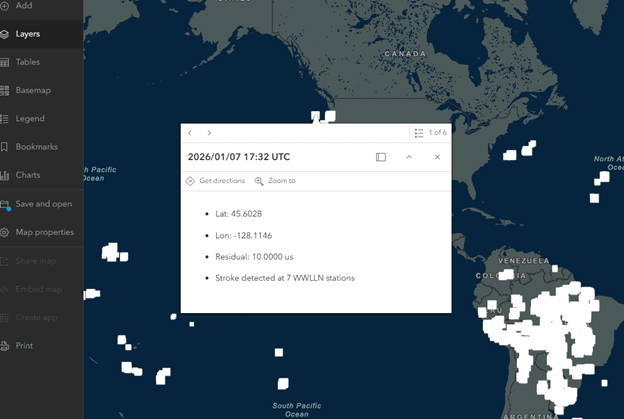
Map of Lighting Strike data reading from URL-based KMZ
The KML gives us some detail about the strikes. The title is the date/time, and the popup provides the location in latitude and longitude, the residual and the stroke detected:
- Stroke detected = WWLLN successfully recorded and located a lightning discharge. A good proxy for intensity.
- Residual = how precise that location is - smaller values mean tighter accuracy.
If all we want is to visualize this, then we’re done. As a KML, there are limits with the symbology we can apply and there’s no time filtering. So, what we can do is convert it into a feature layer with full functionality. To do this, we use ArcGIS Notebooks. ArcGIS Notebooks is a web-based, Jupyter-powered platform that integrates Python with spatial analysis, data science and machine learning for automating workflows, managing data, visualizing results and building applications. We use it to import Python modules for data management and to schedule updates between the source and feature layers. It’s included with ArcGIS Online and available as an optional install in ArcGIS Enterprise.
We created Python code that reads KML files and updates a feature layer with new data every hour. The Python notebook is available for your use. You can download it here.
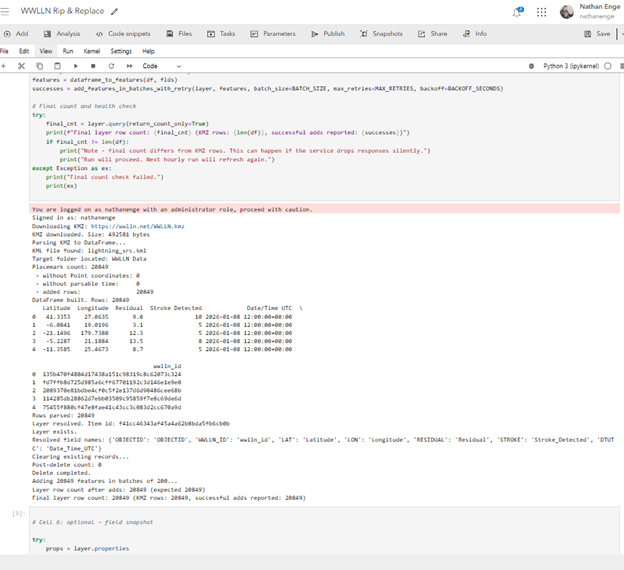
Sample screenshot of notebook
This script grabs the WWLLN lightning KMZ, opens the KML, walks the “WWLLN Data” folder and turns placemarks into a tidy table with lat, lon, UTC time, residual,and station count. It builds a stable stroke id from lat/lon/time, then publishes the points to ArcGIS Online. If the layer isn’t there, it creates it. If it is, it clears it and reloads using batch adds with simple retries to keep the numbers right. It enables time on the UTC field for time sliders, enforces the sublayer name and updates the item details so the service shows source, a short summary and the last update time.
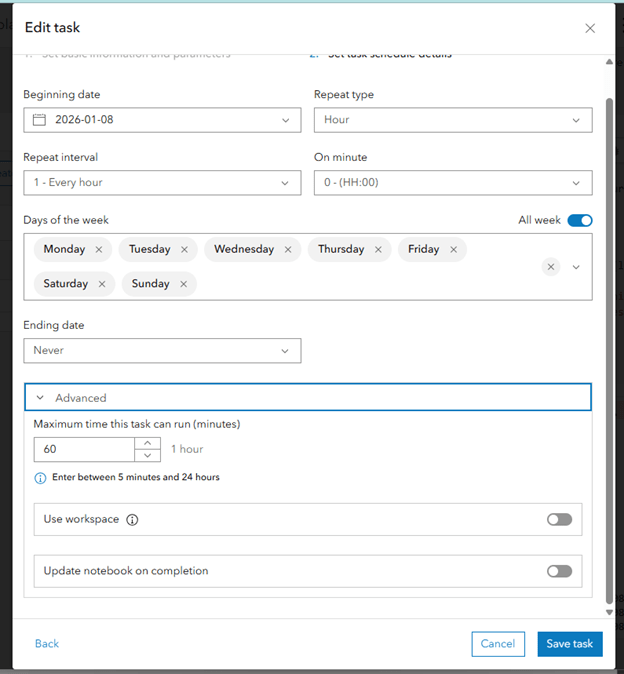
Now all we have to do is schedule the task to run every hour to keep our layer fresh. We can do this from the Tasks button in Notebooks:
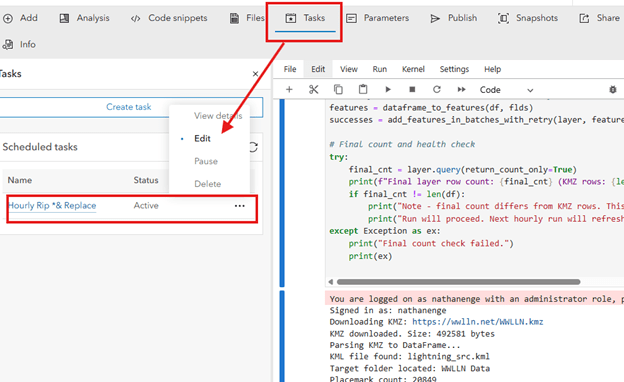
Scheduling Tasks
Now all we have to do is schedule the task to run every hour to keep our layer fresh. We can do this from the Tasks button in Notebooks:
Scheduling Tasks
We can always check the status of the task to see whether it has run successfully or failed:
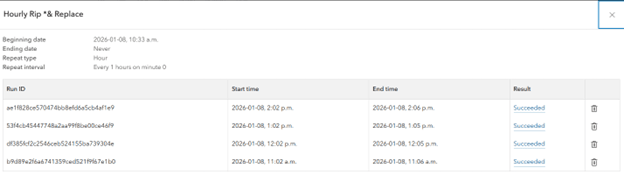
View details of previously run tasks
If we look at the item details for the feature layer, we can see that the description and
summary are updated with the last update of the layer:
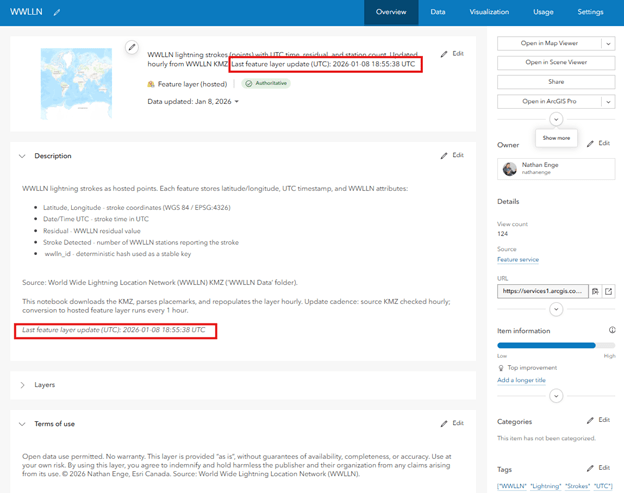
Item Details with update frequency
Now we can use it in the mapviewer and give it some better symbology. We’ve added the layer to our mapviewer, enabled time and turned on hotspot so we can see lightning strikes within a 1-hour window. We can click on an area and see information about that strike:

Feature Layer added to Mapviewer
If we do not have access to a commercially available feed, we can leverage this KMZ from the WWLLN and use ArcGIS Notebook to create and update a feature layer for further analysis or to ingest in our safety and emergency operation centers.
One more thing, since I'm not a coder, I relied solely on M365 Copilot to create and refine all the code for my notebook. Say what you want about the rise of the machines – but AI helped this guy do something in 1 hour which would of taken 1 week to figure out (then another week to try and find somebody to do it).