Location analytics cheat sheet: many ways to do spatial analysis in ArcGIS
Presenting a comparative guide to some ArcGIS tools that can help you understand more about position, area and size of things. Through spatial analysis, you can discover patterns, connections and trends in your geographic data.
What is spatial analysis?
Considering that everything that matters to us is located somewhere on (or relative to) our Earth’s surface, understanding it all can be a daunting task. Location is used by the various ArcGIS products as the connective thread to help you investigate how the environment affects the challenges you need to solve or the opportunities you want to discover, such as climate change, customer behaviour, resource allocation and more. Analytics, in the spatial context, is the process of examining the locations, attributes and relationships of features in your data to help you, your collaborators and your decision-makers gain a better understanding and answer questions. Or to borrow a definition from The Language of Spatial Analysis: “Spatial analysis is how we understand our world—mapping where things are, how they relate, what it all means and what actions to take.” Spatial analysis and data science (aka location analytics) are just some of the many capabilities of GIS. And there are plenty of tools available for proximity, overlay, network, temporal, statistical and 3D analyses.
Before choosing the appropriate tool (function, widget or computational method) to apply to specific datasets, you might be wondering just where you should look to harness the power of spatial problem-solving: Web GIS, your desktop software, your development environment or a combination? The following information will get you more acquainted with Esri’s comprehensive collection of basic to advanced spatial algorithms and methods.
In Web GIS
We begin our comparison journey with Web GIS, which is deployed in the cloud as ArcGIS Online’s software as a service (SaaS), or on-premises as ArcGIS Enterprise’s server infrastructure (Portal for ArcGIS) or both (because you can if you want). The Web GIS has what is called a web portal for storing, organizing and accessing geographic content (e.g. web layers) via the internet/intranet. Your web portal comes with two viewers for visualizing your web layers in 2D web maps using Map Viewer and 3D web scenes using Scene Viewer. Use the appropriate viewer to create your web maps or web scenes but also to access spatial analysis capabilities. Note that performing spatial analysis in Map Viewer in ArcGIS Enterprise requires version 11.2+ and performing it in Scene Viewer in ArcGIS Enterprise requires version 11.5+, whereas Map Viewer and Scene Viewer in ArcGIS Online are good to go as-is (that’s the advantage of a thrice-annually updated SaaS).
Important: Your user type must include the privilege to publish because when you run the spatial analysis tools you will be outputting data that must get published to the portal. See the following for some additional tips when performing spatial analysis in Map Viewer:
- FAQ: Why don't I see the Analysis button in Map Viewer?—Esri Community
- Understand credits for spatial analysis—ArcGIS Online
- Understand credits for spatial analysis—Portal for ArcGIS
Web apps are another item that you can create as content in your web portal. They are an effective way to share a more focused and often interactive view of the data displayed in your web maps and scenes, but one of the builders can also expose analytical capabilities to your app users. ArcGIS Experience Builder has the Analysis widget that allows you to add spatial analysis tools, raster functions and geoprocessing tools to apps. Note that the Analysis widget in ArcGIS Enterprise requires version 11.3+ but it is ready to be inserted via the ArcGIS Online version of ArcGIS Experience Builder. This one mighty widget can take advantage of the same built-in spatial analysis tools and raster functions available in Map Viewer, along with any custom geoprocessing tools from your ArcGIS organization and tools published with ArcGIS Notebooks. Look at that: web-based viewers and apps are for more than just looking at!
Self-paced e-learning
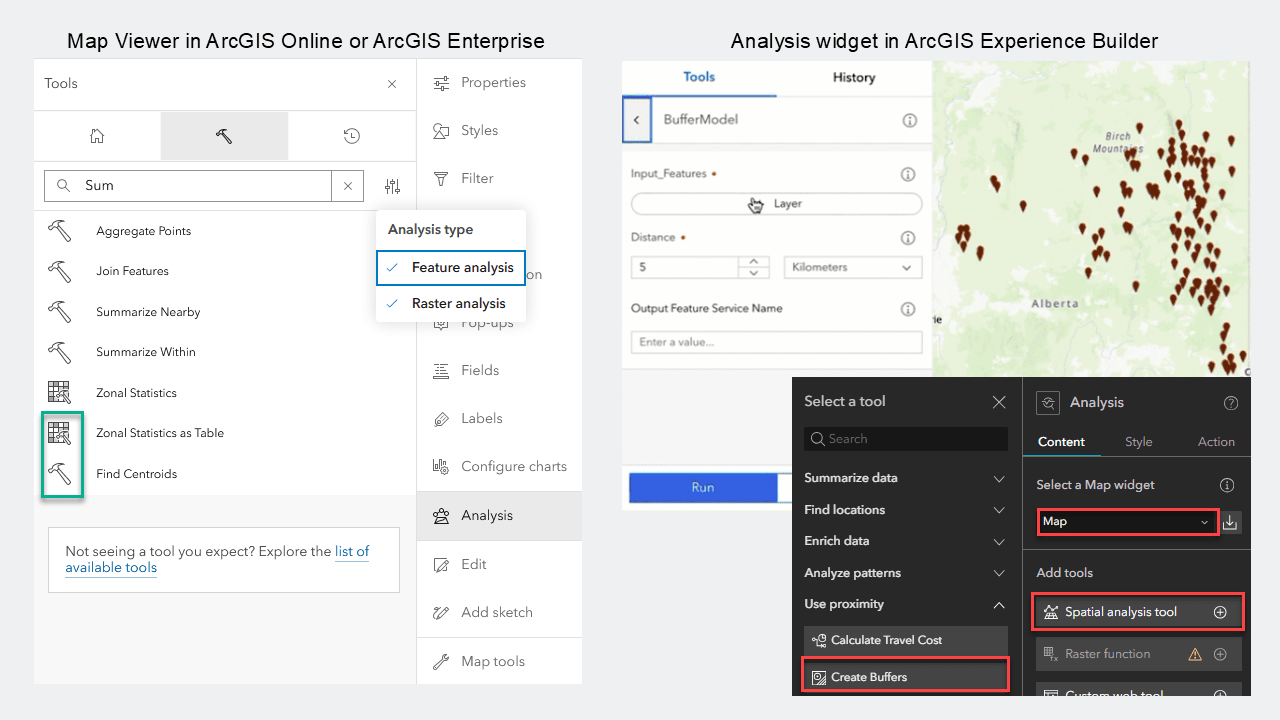
In Map Viewer, open the Analysis pane from the Settings (light) toolbar. Those same feature and raster analysis tools can be made accessible to your app users in ArcGIS Experience Builder when you insert the Analysis widget and configure it with the content—data and tool(s)—that you want them to use.
In desktop GIS
Next stop on our location analytics comparison is desktop GIS, or specifically ArcGIS Pro, which is Esri’s comprehensive workhorse for spatial analysis in ArcGIS Pro. It features geoprocessing tools, raster functions, modelling, scripting (see below), big data and GeoAI, with or without additional licensed extensions (e.g. Spatial Analyst, Business Analyst, Image Analyst, Geostatistical Analyst, Network Analyst, 3D Analyst) to help you perform literally hundreds of spatial analytics and data science workflows.
Of course desktop GIS means you can use local data stored in file geodatabases or folders as inputs to the analysis tools. Because ArcGIS Pro is integrated with your Web GIS, you can also bring in all kinds of data from web layers hosted or stored as services. And if ArcGIS Enterprise 11.2+ is your portal, then you have the option to set up ArcGIS Knowledge to store and access graph databases and then analyze the connected data within your ArcGIS Pro projects, spatially and with graph analytics. So many possibilities!
In Python scripts
If the built-in tools and functionality of your web or desktop GIS are missing that certain extra something, you can expand your spatial analysis with automation and customizations using the official scripting language of ArcGIS: Python. Why use Python scripting? Well, you can efficiently automate using geoprocessing tools in Python, create custom script tools and toolboxes, and/or import the available third-party Python libraries to incorporate additional spatial analytics and data science.
ArcPy and the ArcGIS API for Python are automatically installed alongside ArcGIS Pro, so you can use the built-in Python window, the ready-to-launch IDLE or your preferred integrated development environment (IDE), and the JupyterLab-based ArcGIS Notebooks. ArcGIS Pro’s geoprocessing tool references include Python syntax and code samples and the full arcpy reference. Depending on your user type, you may also use Python in a notebook in ArcGIS Online or ArcGIS Notebook Server in ArcGIS Enterprise. See ArcGIS API for Python for the full developers’ reference on the API. Now that’s a lot of choice all across the ArcGIS platform!
Self-paced e-learning
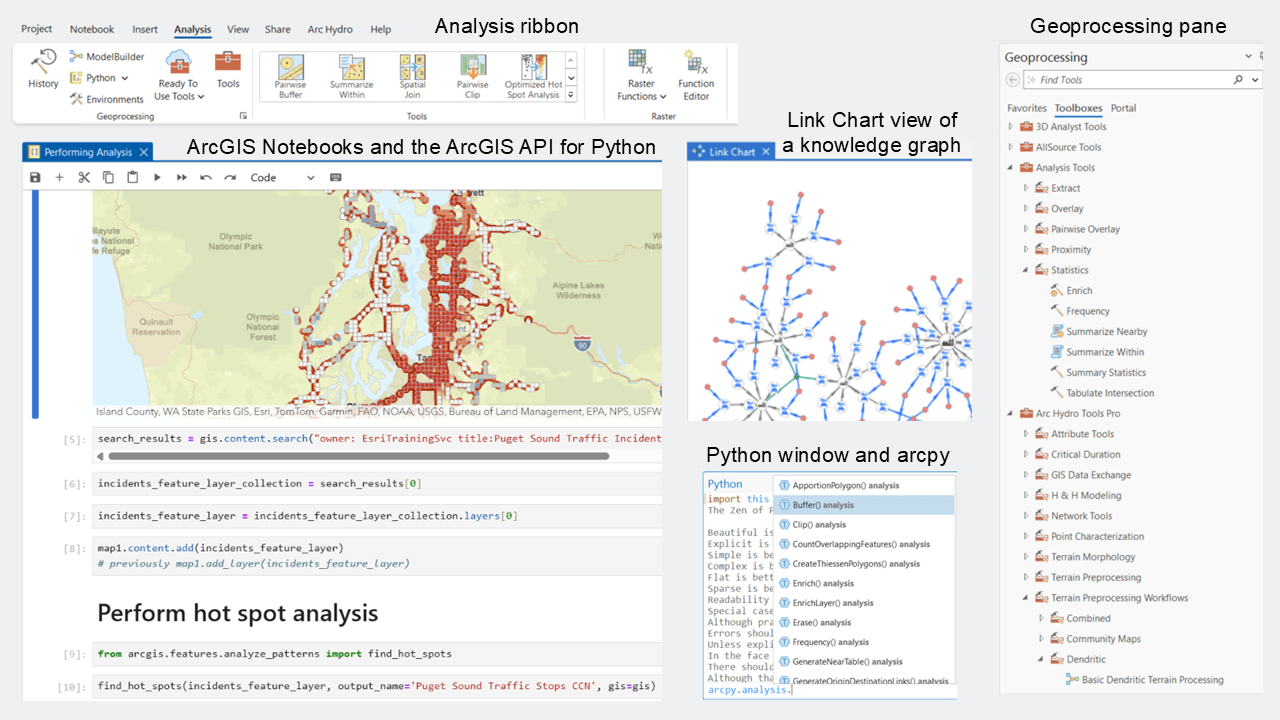
ArcGIS Pro has a user-friendly interface for running tools from the Analysis ribbon and the Geoprocessing pane. The Geoprocessing toolboxes can contain Python script tools. You can also open the Python window interactive console and run analysis tools directly from ArcGIS Pro through a Python interpreter, without requiring a script file. ArcGIS Notebooks allows you to perform analysis and immediately view results in a geographic context, interact with the emerging data, document and automate your workflow, and save it for later use or share it. And knowledge graphs provide additional analytical capabilities.
All together now
Each of the above topics includes links to the web help identifying their respective spatial analysis functionality. Now for the ultimate cheat sheet: here is a convenient cross-reference among the various ways to apply location analytics to your data through Web GIS, desktop GIS and development environments. To keep this somewhat under control, I have limited the cheat sheet to what each tool is called based on those that are available in the ArcGIS Online version of Map Viewer (February 2025 update).
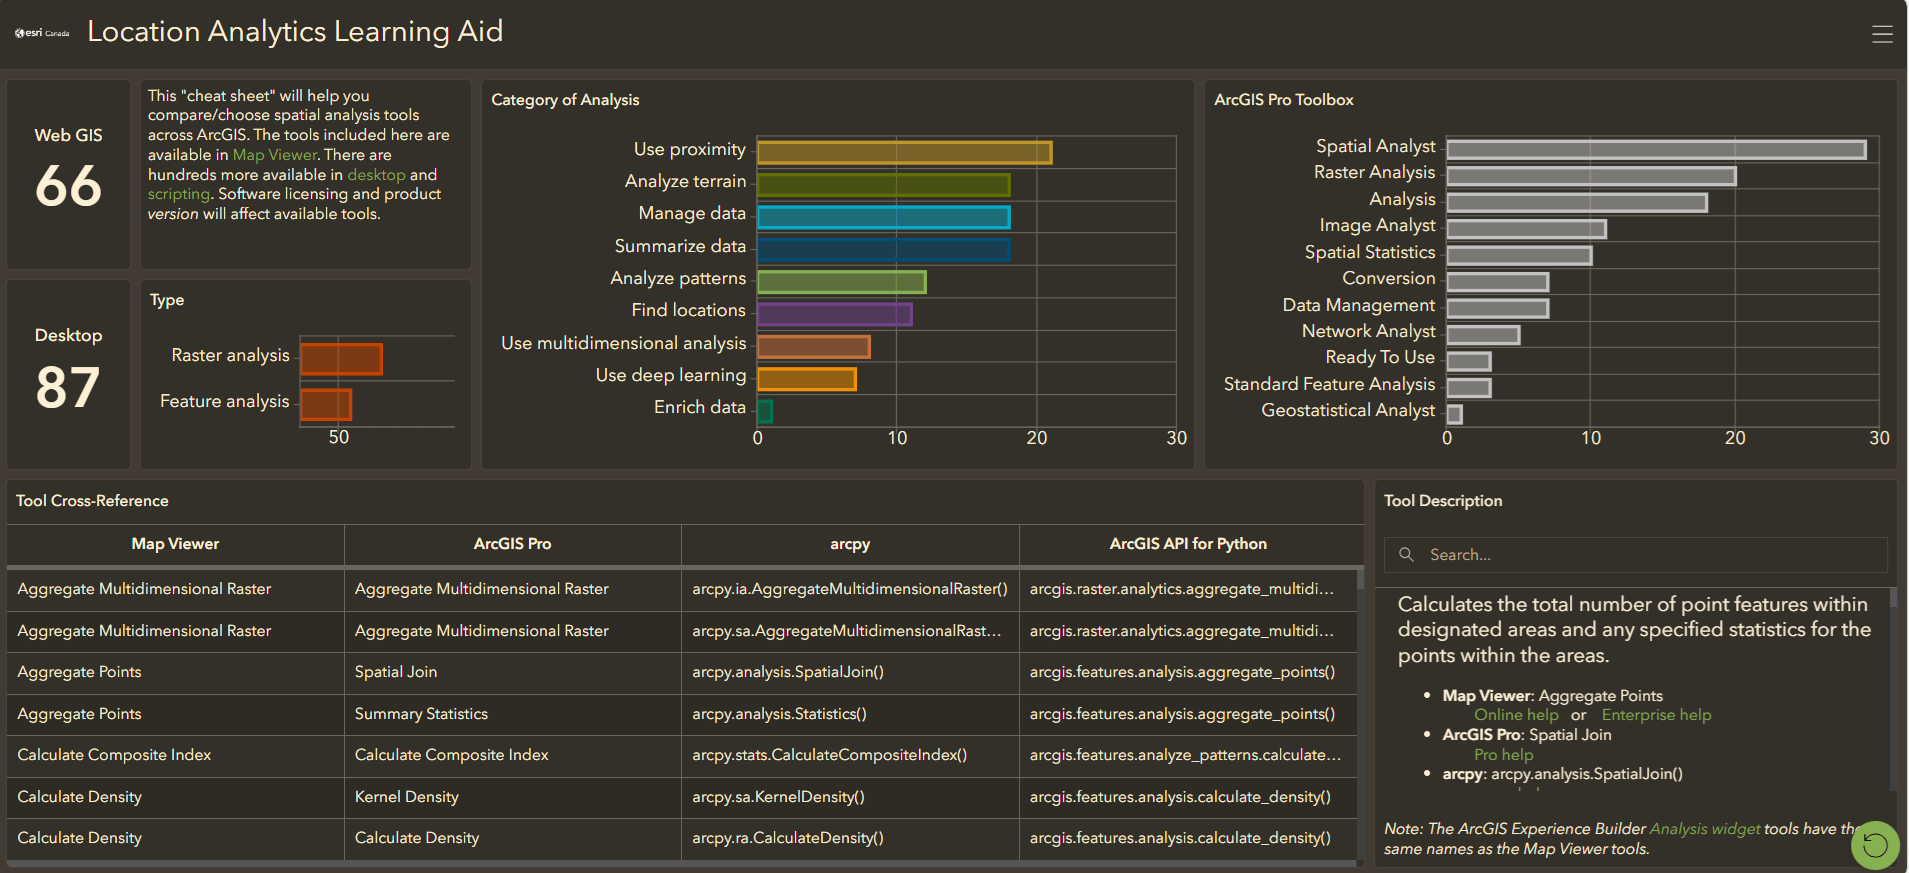
The Location Analytics Learning Aid (aka cheat sheet, but the acronym LALA is more fun) is an interactive ArcGIS Dashboards application for you to explore and compare the names of various spatial analysis tools across the ArcGIS platform.
Important: The version and licensing of your ArcGIS software products and any required extensions or server configurations will affect tool availability. If you don’t see a particular tool, then check for the following:
- Licensing requirements for spatial analysis—ArcGIS Online
- Licensing requirements for spatial analysis—Portal for ArcGIS
- Requirements—ArcGIS Experience Builder
- ArcGIS Pro licensing—ArcGIS Pro
- ArcGIS Pro extensions—ArcGIS Pro
You may have noticed the convenient links to my curated web tutorials above. But if you prefer a guided educational experience within a virtual classroom of like-minded peers, then attend our instructor-led online courses for the GIS applications that you are most interested in:
|
Course name and details |
Web GIS |
Desktop GIS |
Python scripts |
|
Introduction to GIS Using ArcGIS Access spatial analysis tools through Map Viewer and the Geoprocessing pane |
✓ |
✓ |
|
|
ArcGIS Pro: Essential Workflows Include geoprocessing tools and ModelBuilder in your projects |
|
✓ |
|
|
Spatial Analysis with ArcGIS Pro Extend geoprocessing with Spatial Analyst, 3D Analyst, Geostatistical Analyst and more |
|
✓ |
|
|
Graph Analytics Using ArcGIS Knowledge Work with connected graph data in ArcGIS Pro |
|
✓ |
|
|
Imagery Analysis in ArcGIS Pro Apply geoprocessing tools and raster functions with Image Analyst and Spatial Analyst |
|
✓ |
|
|
Surface Water Analysis and Arc Hydro in ArcGIS Pro Specialized tools that rely on Spatial Analyst |
|
✓ |
|
|
Geospatial and Mining Geoscience using ArcGIS Pro Extend geoprocessing with Spatial Analyst applied to mining data |
|
✓ |
|
|
Working with 3D Using ArcGIS Pro Involve tools that rely on 3D Analyst |
|
✓ |
|
|
ArcGIS Online Essentials: Public Health Edition Access spatial analysis tools through Map Viewer applied to health data |
✓ |
|
|
|
Building Web Apps with ArcGIS Experience Builder Everything about web experiences, including the Analysis widget |
✓ |
|
|
|
Creating Python Scripts for ArcGIS ArcGIS Notebooks within ArcGIS Pro to use the arcpy module |
|
✓ |
✓ |
|
Introduction to the ArcGIS API for Python No actual analysis, but learn how to use the arcgis module |
|
|
✓ |
Want to stay informed about all the latest training opportunities at Esri Canada? Visit Esri Canada’s Communication Preference Centre and select the “Training” checkbox to get a monthly roundup straight to your inbox.