Beginner’s guide to ArcGIS Business Analyst for smarter decisions
Making informed business decisions starts with understanding location. In this blog, you’ll learn what ArcGIS Business Analyst offers, why location intelligence is critical for market analysis and how the Web App helps you quickly access demographic data, visualize patterns and create reports, all without complex GIS workflows.
When you think about business decisions such as where to open a new store, how to reach a high volume of target customers or which markets have the most potential, location matters. The question is how to turn location data into actionable insights. ArcGIS Business Analyst provides the answer.
What is ArcGIS Business Analyst?
ArcGIS Business Analyst is Esri’s solution for location-based market and community analysis. It combines demographic, socioeconomic and consumer data with powerful mapping and analytics tools, helping organizations make smarter decisions. Whether you’re a retailer planning expansion, a government agency allocating resources or a consultant analyzing market trends, ArcGIS Business Analyst gives you the tools to answer critical questions like:
- Where are my customers?
- Which neighborhoods have the highest spending potential?
- How do different trade areas compare?
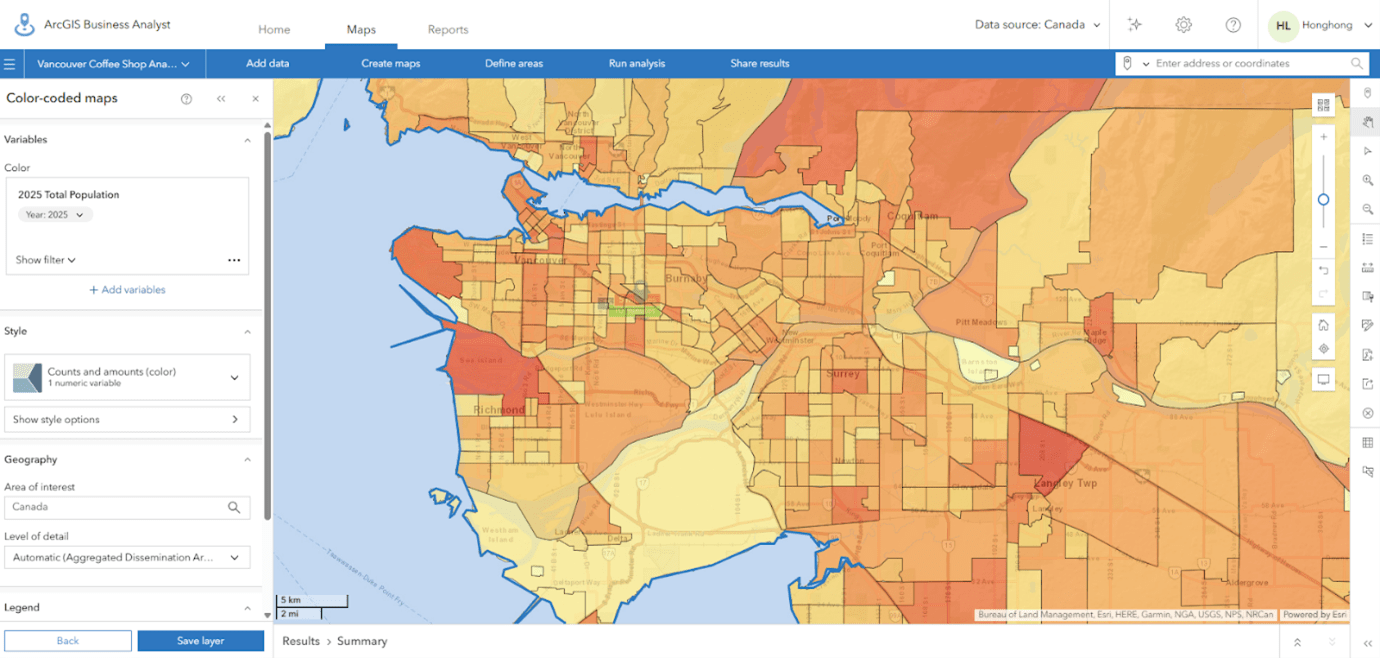
Colour-coded map of Vancouver's population distribution using ArcGIS Business Analyst
Different ways to use ArcGIS Business Analyst
Business Analyst isn’t just one product, it comes in several forms to fit different workflows:
- Business Analyst Web App – A browser-based application for quick, intuitive analysis and reporting.
- Business Analyst Pro – An extension for ArcGIS Pro, ideal for advanced GIS users who need custom workflows.
- Business Analyst Enterprise – An on-premises solution that provides secure, scalable and flexible tools for improving collaboration and integrating location intelligence across your organization.
- Business Analyst Mobile App – A mobile companion app that lets you visualize key indicators, perform market research on the go and collaborate seamlessly with your team.
In this article, we’ll focus on the Web App, because it’s the easiest way for beginners to start exploring location intelligence.
Why use ArcGIS Business Analyst?
ArcGIS Business Analyst is designed for professionals who need location-based insights to make better decisions. Common users include:
- Retailers and businesses for site selection and market expansion.
- Government agencies for community planning and resource allocation.
- Consultants and analysts for demographic studies and strategic planning.
Why start with the Web App?
While BA is available in multiple formats, the Web App is the most accessible for new users. It requires no software installation, offers an intuitive interface, and provides quick access to global data and ready-to-use workflows, making it perfect for getting started without deep GIS expertise.
With the Business Analyst Web App, you can:
- Access global demographic and business data for over 170 countries.
- Visualize patterns using colour-coded maps.
- Generate presentation-ready infographics and reports.
- Perform workflows like trade area analysis, suitability analysis and market potential assessment.
Key Features You’ll Love
- Smart Map Search – Find areas that meet specific criteria (e.g., income level, population size).
- Colour-Coded Maps – Visualize demographic variables across regions.
- Site Selection Tools – Create rings or drive-time areas around a location.
- Infographics and Reports – Summarize insights in customizable, shareable formats.
- Suitability Analysis – Rank and score multiple sites based on weighted criteria.
- Void Analysis – Identify gaps in services or businesses compared to competitors.
- Threshold Area – Build trade areas that meet a specific threshold, such as population or income.
- Benchmark Comparison – Compare your site’s performance against a benchmark or another location.
These tools make it easy to move from raw data to actionable insights, even if you’re new to GIS.
Example: choosing a location for a coffee shop
Let’s walk through a real-world scenario: you’re planning to open a new coffee shop in Vancouver, but you want to make sure you pick the best spot. Here’s how you can use ArcGIS Business Analyst Web App to help you decide.
Step 1: sign in and create a project
First, log in to the ArcGIS Business Analyst Web App. Create a new project to keep everything organized. Your sites, maps, and reports will all be saved here. Think of a project as your workspace for this analysis.
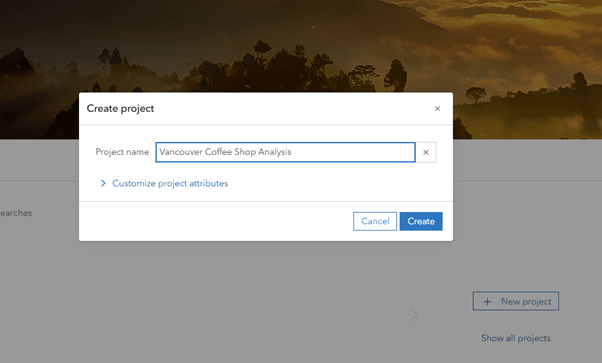
Creating a new project in the ArcGIS Business Analyst Web App.
Step 2: add a site
Next, choose a potential location. You can type in an address, search for a landmark or draw a custom area on the map. In this example, I have already selected a potential site for the coffee shop, so I will use the Pin tool from the toolbar on the right and drop a pin to create a site. After placing the pin, I will select Create a Site.
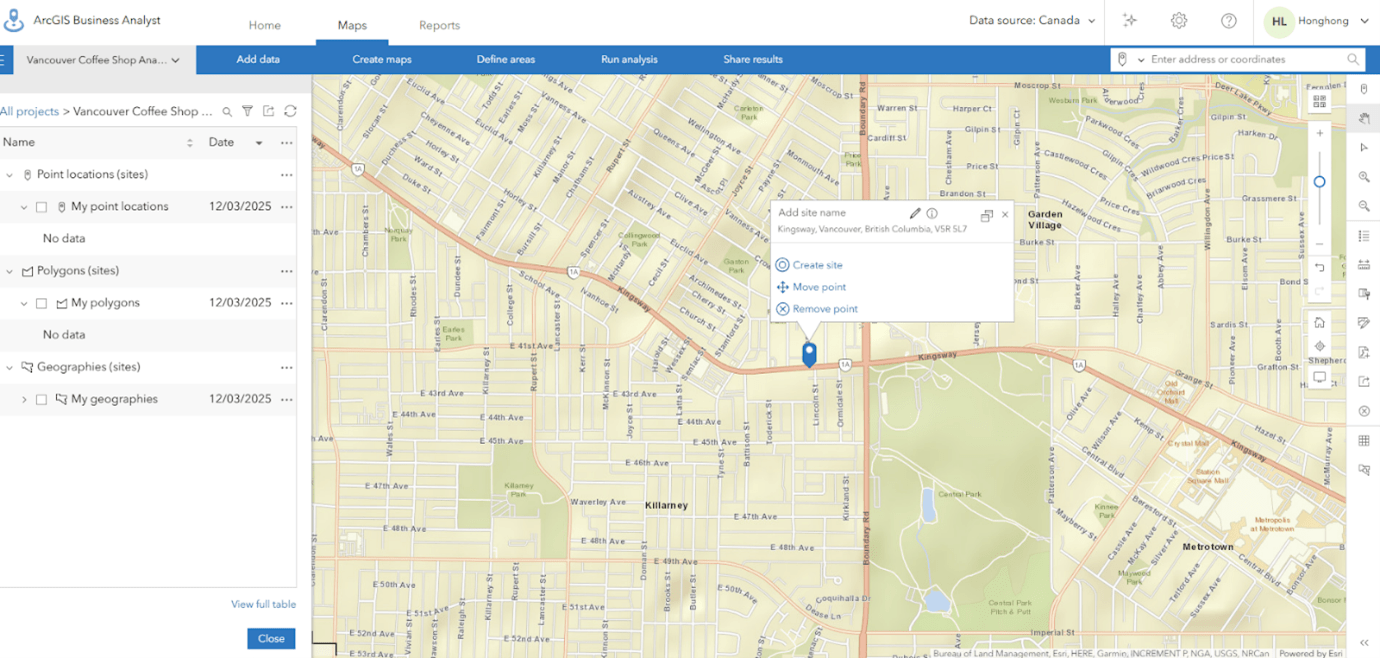
Adding a site to the map in ArcGIS Business Analyst.
Step 3: define a trade area
Once you have your site, create a trade area to understand the surrounding market. You can create buffer rings by entering a radius distance, drive time or walk time. Since the coffee shop is intended for people who live nearby, I will choose walk time to create the buffer rings. I will use 5, 10 and 15 minutes as the walking time buffers. This helps you see who lives or works nearby and how accessible your shop will be.
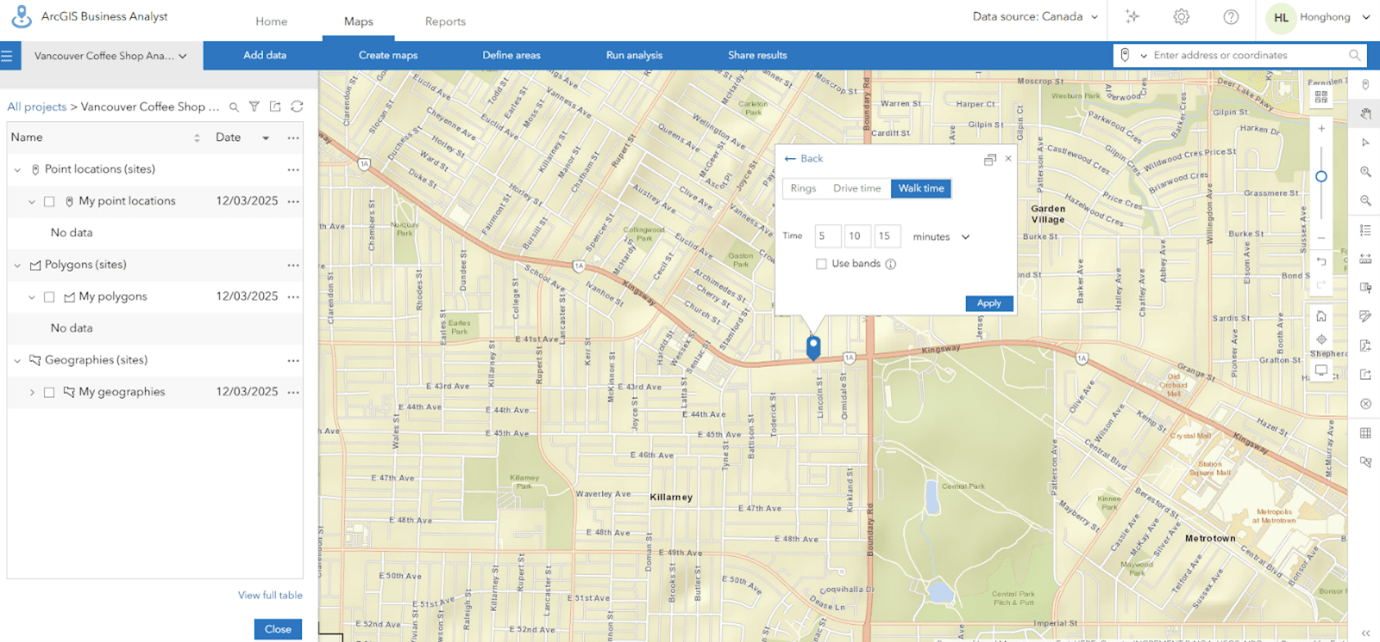
Setting walk-time buffers for trade area analysis.
Once you have created the buffers, you will see three different coloured buffers representing different walking times. Demographics will be analyzed based on these rings.
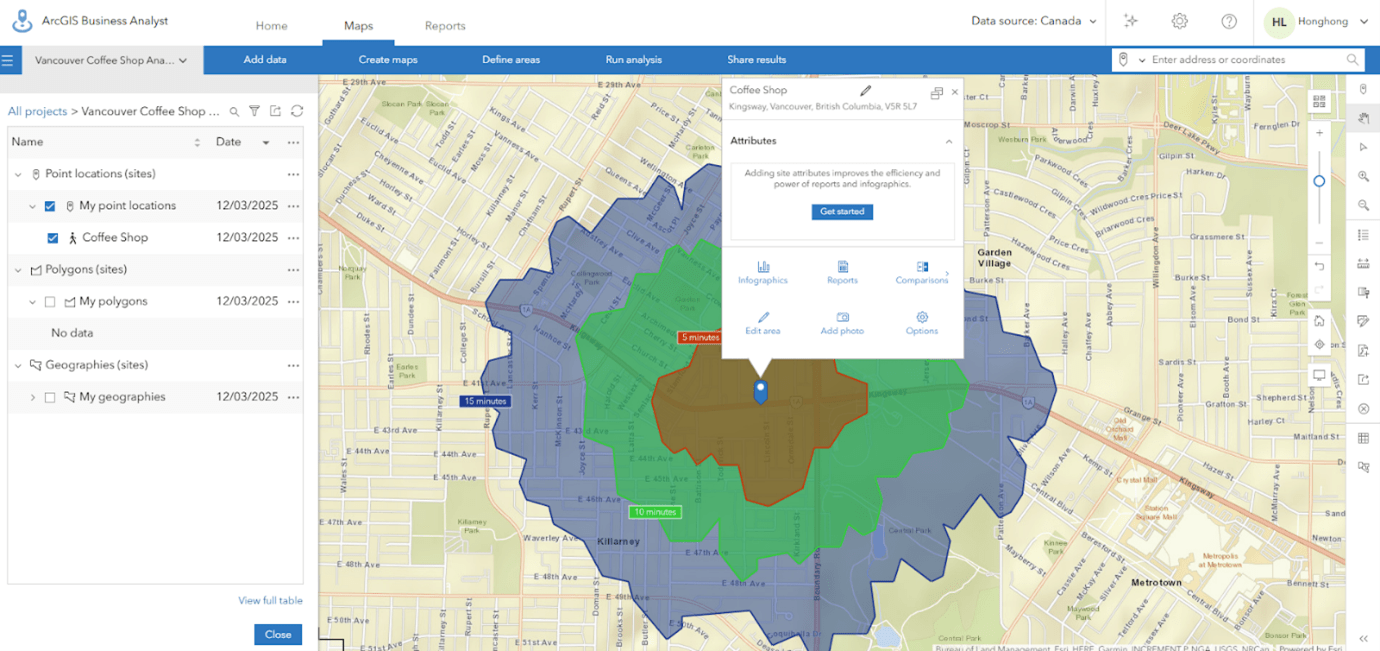
Trade area buffers are displayed around the selected site.
Step 4: explore demographics
Now it’s time to dig into the data. Open the Smart Map Search section from the top menu.
Options for creating maps in ArcGIS Business Analyst.
On the left, you’ll find several popular variable lists that you can use to check demographics, such as population, income, age or education. If you click the icon next to the number, you’ll see which variables are included in that list specifically.
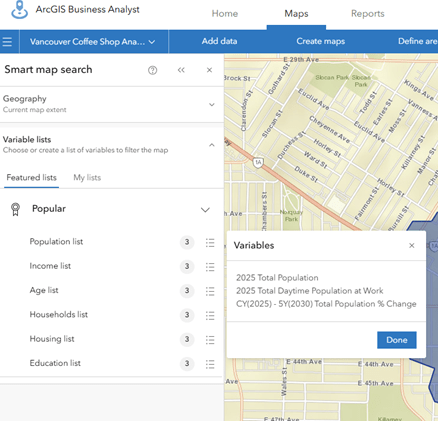
Selecting variable lists in Smart Map Search.
If none of the existing variable lists meet your needs, you can create your own by selecting “Browse all variables.” The Data Browser offers different categories of variables, and you can add up to ten variables to a single list.
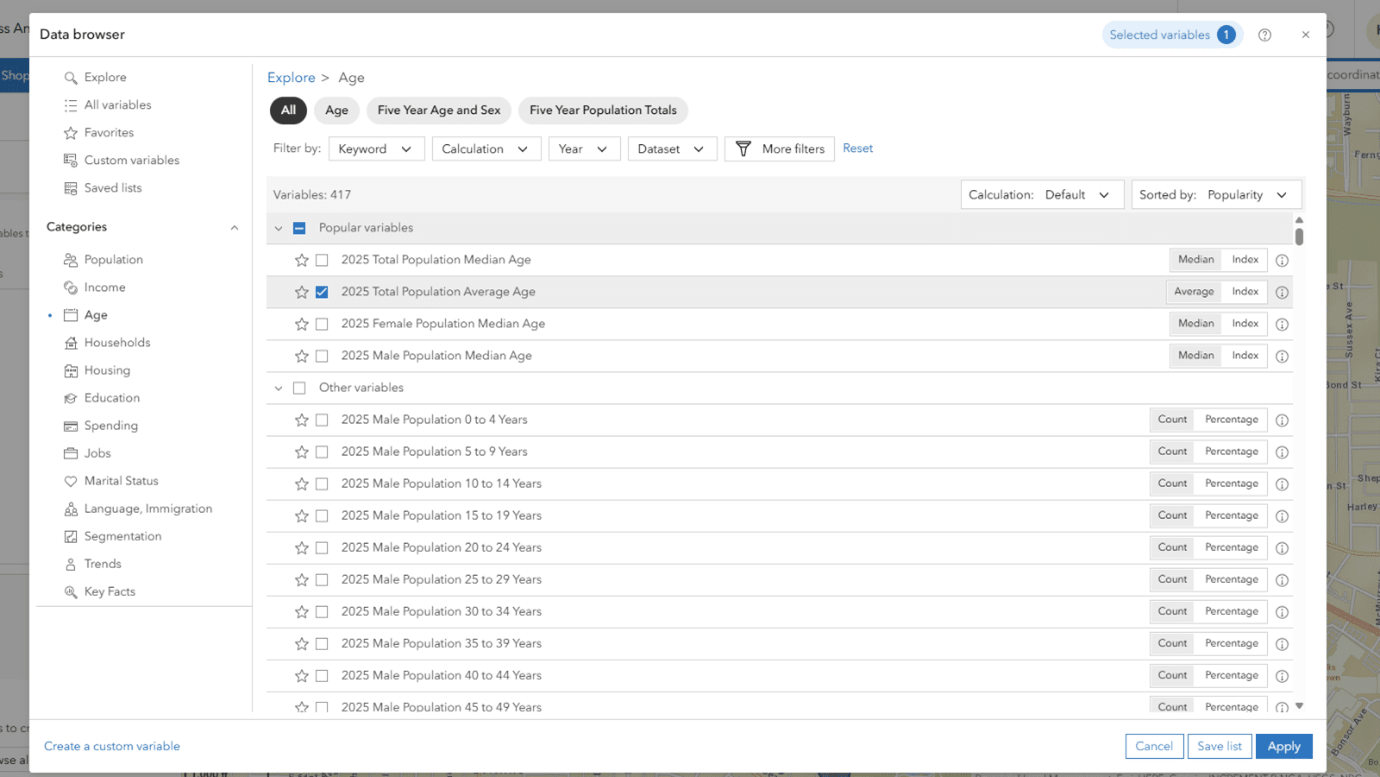
Browsing demographic variables in Data Browser.
In this example, a custom list was created that includes “2025 Total Daytime Population at Home Aged 15–64,” “2025 Household Expenditures: Total Current Consumption” and “2025 Household Average Income (Current Year $).” These variables indicate the purchasing power of nearby residents for coffee.
Once the variable list is applied, detailed demographic information will be displayed. You can also view data for each dissemination area by hovering your mouse over the area you want to check.
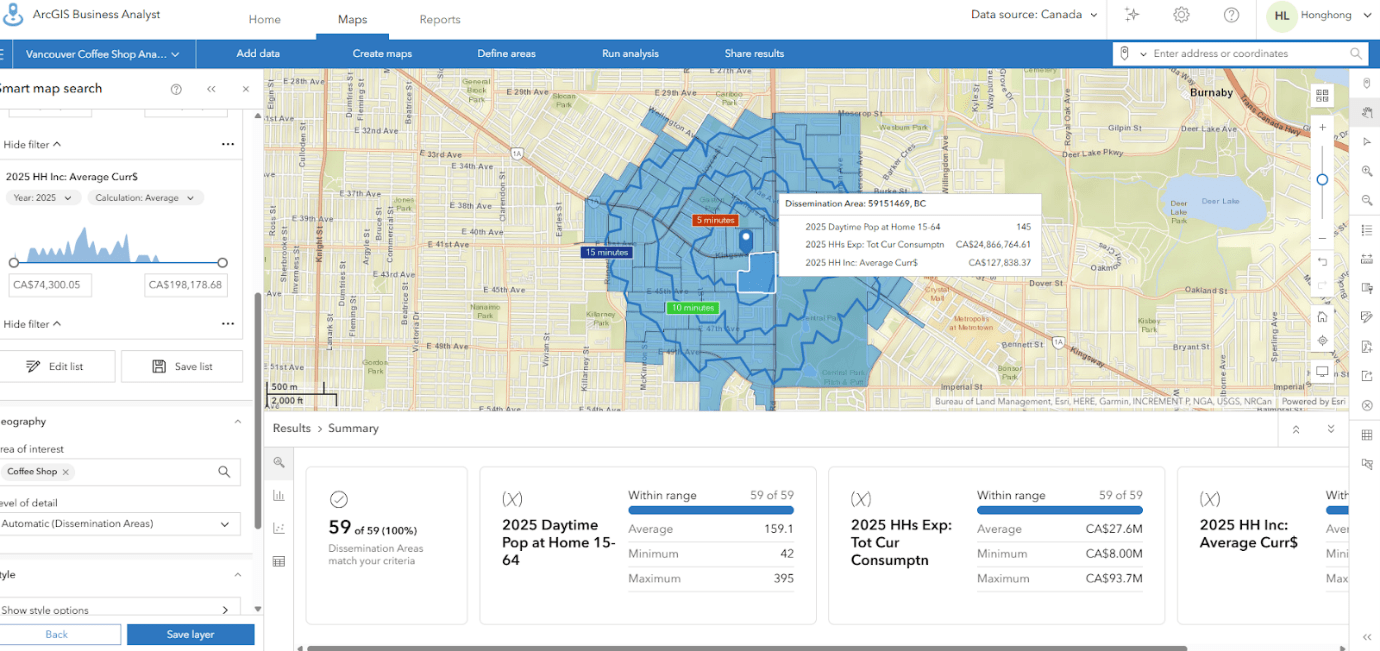
Viewing demographic results in Smart Map Search.
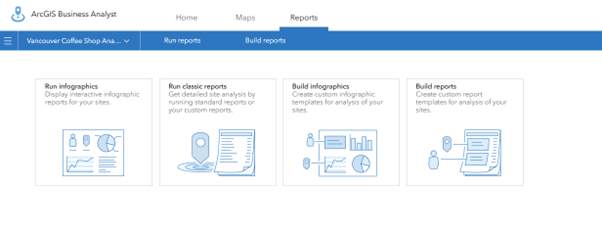
Step 5: generate reports for decision-making
Finally, create a report to summarize what you have found. Business Analyst lets you build infographics or detailed PDF reports showing demographics, lifestyle segments and market potential. These reports are perfect for sharing with your team or investors. You can build your report using an existing template or by creating your own.

Options for running or building reports and infographics.
Alternatively, you can create an infographic by selecting the ones you are interested in.
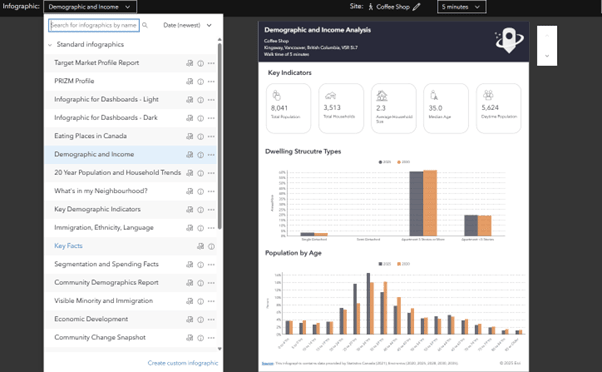
Example of a demographic and income infographic report.
In just a few steps, you will have a clear, data-driven picture of whether your chosen location is a good fit for your coffee shop. Instead of guessing, you are making decisions backed by real market insights.
Final thoughts
ArcGIS Business Analyst Web App empowers organizations to make informed, location-based decisions quickly and effectively. With its intuitive interface, rich data and powerful analysis tools, even beginners can start answering critical business questions from day one.