Part 2: Can AI Extract Planning Data from Zoning By-laws Accurately?
Part 1 introduced the problem: Can AI (LLMs specifically) extract planning data from Zoning By-laws accurately enough to be useful? It examined the different types of LLM models, how to choose the right model for the task, and what the different risks and limitations of each model are.
As concluded in part 1, the best LLM models for the task are encoder-only Question Answering (QA) models like BERT (Bidirectional Encoder Representations from Transformers) and RoBERTa (Robustly Optimized BERT Approach). Part 2 of this blog focuses on evaluating and comparing the accuracy of the LLMs at extracting planning information from the Zoning By-laws. To do this we need to 1) choose both the appropriate metrics and 2) prepare data for evaluation.
How to choose the right evaluation metric

There are many different standardized metrics used to evaluate different LLM models and there is no “one size fits all” approach.
It is important to understand how well an AI model performs at a given task, especially if used in domains where the accuracy of output is important (such as development applications and/or urban planning). There are many different standardized metrics used to evaluate different LLM models and there is no “one size fits all” approach. Choosing the right metric largely depends on how the LLM is being used/the task it is performing.
There are three overall categories of metrics:
- Generic metrics can be applied to a variety of situations and datasets (precision and accuracy)
- Task specific metrics are for a given task. For example: “BLEU” is popular for machine translation and “sequeval” for Named Entity Recognition (NER)
- Dataset specific metrics measure model performance on specific benchmarks. Some datasets have metrics associated with them, for example “SQuAD”, which is expanded on below.
The Stanford Question Answering Dataset (SQuAD) is a widely used dataset-specific metric (benchmark) for evaluating Question Answering models, like we’ll be doing. The original paper (Rajpurkar et al., 2016) introduced two key evaluation metrics that have since become standard in the field. The two key metrics that were introduced are called Exact Match (EM) and the F1 score.
Exact Match (EM):-This metric measures the percentage of questions where the model's answer exactly matches one of the ground truth answers.
F1 Score:-This metric calculates the overlap between the predicted answer and the ground truth answers. It considers both precision (the number of correct answers provided by the model) and recall (the number of correct answers that should have been provided). A higher F1 score indicates a better performing model. The F1 score is good with imbalanced datasets where accuracy can be misleading. More information on the F1 Score.
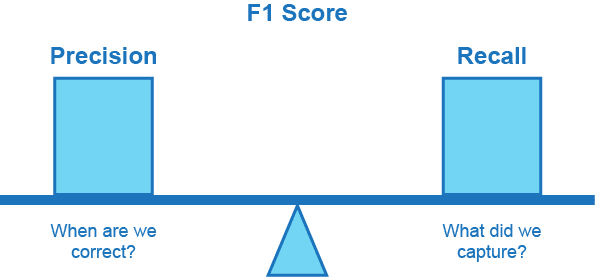
This diagram explains the F1 Score. Refer to the further reading links for more information!
Further Reading:
Prepare the Data for Evaluation!

The backbone of LLMs is data. They require high quality and clean data to perform optimally.
The backbone of LLMs is data. Question Answering LLM models require high quality and clean data to perform optimally. To prompt a Question Answering Model, data needs to be formatted with three fields:
The question to be assessed: “What is the maximum floor space ratio for a high-rise apartment provided that it fulfills all the residential floor area requirements?”
Context (the context is a snippet from the Zoning By-law given to the question answering LLM model. The model will extract the answer to the question from the given context): “In the R5-2 district, for high-rise apartment: (a) the form of tenure must be residential rental tenure for 100% of the residential floor area; and (b) the maximum floor space ratio is 5.50 provided that: (i) a minimum of 20% of the residential floor area is secured as below-market rental dwelling units, or (ii) 100% of the residential floor area is developed as social housing.”
Ground Truth or the desired and correct answer: “5.50”
If the context does not contain the answer to the given question, the model may get confused and be unable to handle those scenarios, requiring separate error handling. Since the goal of this experiment aims to test the performance and accuracy of the model itself, rather than its ability to detect missing answers, any context without the answer has been removed from the evaluation dataset. This ensures that all test cases focus solely on the model's answer extraction capabilities.
Unlike generative LLMs like GPT, models specifically for Question Answering are trained to understand text only and will not be able to understand text formatting. Therefore, contexts from the Zoning By-laws must be cleaned to remove table formatting, bullet points, and paragraph breaks.
To really test the efficacy of the models in extracting the zoning information, a range of different questions and contexts from different zoning by-laws throughout Canada should be used. The more diverse the questions and contexts are, the better.
A dataset of 50 example zoning questions will be used to prompt the Question Answering LLM model and its responses will be evaluated against the Exact Match (EM) and F1 Scores. This style of prompting, where a model performs a task without recognizing the concept/data or has received no specific training on the examples, is called Zero Shot.
Link to the case study on Github for readers interested in the source code and workflow.
How well did DistilBERT and RoBERTa perform?
Output Example Snippet:
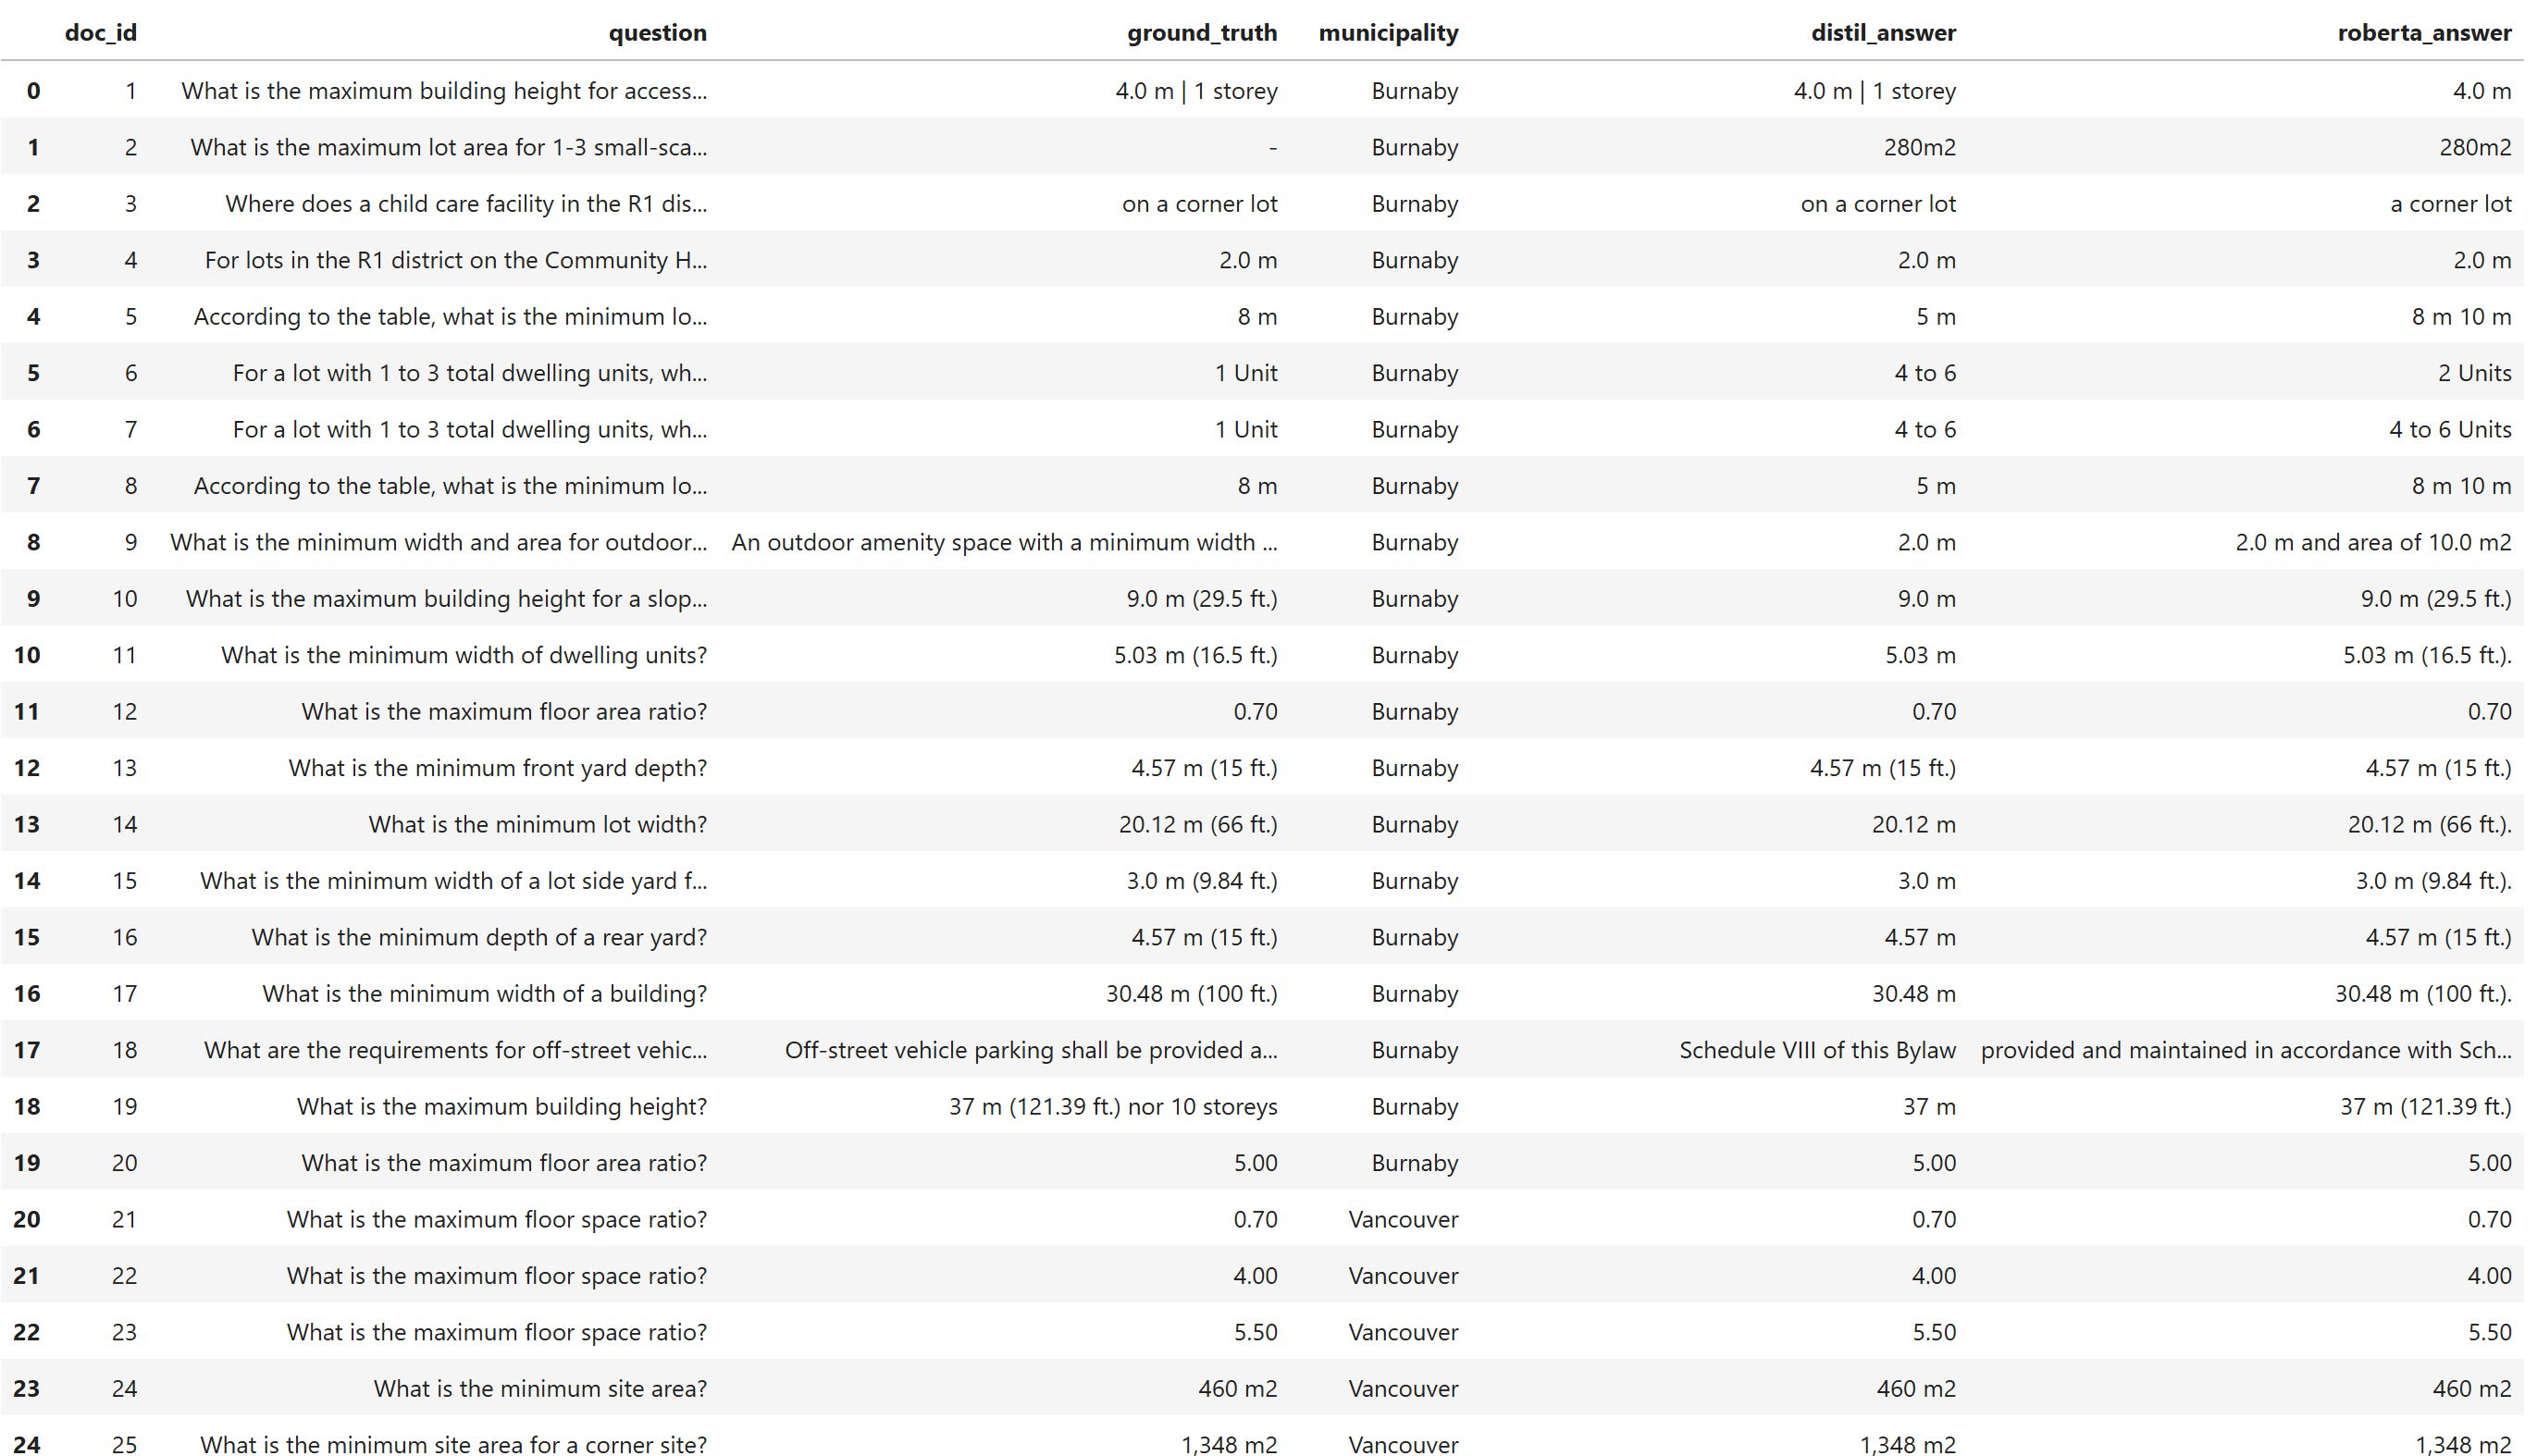
Snippet of the output table with the LLM responses. Refer to the Github link for the full table.
DistilBERT Metrics
- Exact Match:-A score of 40% of predictions matching exactly the ground truth.
- F1 Score: -66.10% token-level overlap between predictions and ground truth.
RoBERTa Metrics
- Exact Match:- A score of 50% of predictions matching exactly the ground truth.
- F1 Score:-73.62% token-level overlap between predictions and ground truth.
At first glance, it is understandable why the Exact Match (EM) scores for both models are only around 50%, or lower. The EM metric is very strict and even a small difference in wording or punctuation counts as incorrect. For example, if the ground truth is "on a corner lot" but the model provides the response "a corner lot", the EM metric will count the response as incorrect. The F1 score is more forgiving and better reflects partial correctness.
Looking at the F1 scores, a score of 70% or higher is considered "okay" in the industry. However, in this scenario where accuracy is extremely important because it involves legal answers, a score of 90-95% or higher is desirable. The fact that there is a significant gap between the EM and F1 scores indicates that the models often produce partially correct answers that don't exactly match the ground truth.
It is not surprising that RoBERTa outperforms DistilBERT on both metrics because it is larger and is fine-tuned on the SQuAD2 dataset (in this experiment a fine-tuned version called roberta-base-squad2 or roberta-base for Extractive QA was used). DistilBERT is a compressed faster model and trades speed for accuracy (because it is 40% smaller it makes it 60% faster at NLP tasks like text classification, sentiment analysis, and question answering). In this experiment a fine-tuned version called-distilbert base uncased distilled squad-is used.
It is also important to consider that the QA models were trained on a variety of other datasets, like SQuAD, and my zero shot dataset may be harder to interpret since they involve legal language and are domain specific. When evaluated on SQuAD, top models normally achieve scores of EM > 85 and F1 > 90. When evaluated using zero shot on out-of-domain datasets, scores tend to drop significantly. Therefore, it might be a good idea to consider fine-tuning RoBERTa on text extracted from zoning by-laws.
Concluding Thoughts
Based on these experiments, using LLMs as a tool for extracting information from Zoning By-laws shows potential at an accuracy of around 70%. The case study reveals that the encoder-only models need further domain specific fine-tuning to see improvements in accuracy.

It is important to consider costs, resources, time, and accuracy when considering using LLMs as a tool.
It is important for people to be aware of the tool’s limitations and choose the type of model they are using wisely.
Some additional considerations:
- Costs and resources: Is it worth spending the time to compile and prepare the data used to prompt the model or train the model? Is the data available in a clean format that the model can consume? In this blog I used a very small 50 example dataset to evaluate the model. For a more robust evaluation, a dataset of 10,000 + examples would be ideal. But at that point, would it be worth the time and effort to compile a dataset of this size? And for zoning do we even have enough data to get to 10,000 examples?
- Accuracy: Hallucinations may occur depending on the model. If the model is meant to be used in fields where accuracy is important (medicine or legal), is it more efficient and less risky to do it manually?
- Time: Do you have the computing power, time, and resources to run the model and/or train fine-tune it? Do you have time to compile and prepare all the data needed to train the model?
Next in-Part 3!
Now that we have done a zero-shot evaluation of DistilBERT and RoBERTa in extracting data from Zoning By-laws, the next part focuses on-domain specific fine-tuning of an existing RoBERTa QA model. The main question to answer is: Does Fine-Tuning an LLM Model on Zoning By-law Data improve its Accuracy?
Some topics to be covered include:-
- Introduction to domain specific fine-tuning - the difference between it and training a base/foundation model from scratch.
- How to pick the right fine-tuning strategy for the task.
- Preparing a training dataset – how large should my training dataset be for the task?
- A brief introduction to understanding training learning curves.